gdpyc — Gas and Dust Python Calculator
gdpyc is a Python 2/3 package for calculating Hydrogen column density
and optical extinction. gdpyc offers functionalities similar
to the nh tool included in HEASoft, or on-line web services like
HEASARC’s nH or IRSA’s Galactic Dust Reddening and Extinction.
This package uses HEALpix maps provided by NASA’s LAMBDA service. Please cite the original papers and authors of the surveys if you use this tool for your research (see sections Surveys and References below).
![]()
![]()
Dependencies
gdpyc depends on:
numpyastropyastropy-healpixregions
Certain functionalities also requiere:
healpixmatplotlib
Example
A simple example of using gdpyc:
>>> from gdpyc import GasMap, DustMap
>>> from astropy.coordinates import SkyCoord

>>> coords = SkyCoord(34.0, -5.0, unit='deg')
>>> GasMap.nh(coords, nhmap='DL')

<Quantity 1.9278499e+20 1 / cm2>

>>> GasMap.nh(coords, nhmap='LAB')

<Quantity 1.9802036e+20 1 / cm2>

>>> DustMap.ebv(coords, dustmap='Planck13')

'0.027179038520908336'

>>> DustMap.extinction(coords, dustmap='SFD', filters='SDSS_r')

<Table length=1>
       SDSS_r
      float64
--------------------
0.049108389441137615

>>> GasMap.plot_map('HI4PI')
Surveys
gdpyc includes several HI and dust surveys with nH and E(B - V)
estimations. We created low resolution HEALPix maps for all surveys
(NSIDE=64 ~ 1 degree pixels) by degrading the original maps using
the ud_grade tool from healpy. Only low resolution maps are
included in the installation. If the user asks for high resolution
maps (hires parameter, see API documentation), they are downloaded
as needed and stored for future use.
HI surveys
DL: Composite all-sky map of neutral Hydrogen column density (NHI), formed from the Leiden/Dwingeloo survey data [1] and the composite NHI map of [2]. The two datasets are not matched in sensitivity or resolution; note that discontinuities exist in the constructed composite map.
DL high resolution data (oversampled), NSIDE=512 ~ 0.11 deg.
LAB: Observations of 21-cm emission from Galactic neutral Hydrogen over the entire sky, merging the Leiden/Dwingeloo Survey [1] of the sky north of -30° with the Instituto Argentino de Radioastronomia Survey [3], [4] of the sky south of -25°. [5]
LAB high resolution data (oversampled), NSIDE=512 ~ 0.11 deg. [6]
HI4PI: The HI 4-PI Survey (HI4PI) is a 21-cm all-sky survey of neutral atomic Hydrogen. It is constructed from the Effelsberg-Bonn HI Survey (EBHIS) and the Galactic All-Sky Survey (GASS). [7]
HI4PI high resolution data, NSIDE=1024 ~ 0.06 deg.
Dust surveys
SFD: All-sky map of Galactic reddening, E(B - V), from a composite 100 micron map formed from IRAS/ISSA maps calibrated using DIRBE observations. [8]
SFD high resolution data (undersampled), NSIDE=512 ~ 0.11 deg.
Planck13: All-sky map of Galactic reddening, E(B - V), using Planck-HFI and IRAS data, for extra-galactic studies. [9]
Planck13 high resolution data, NSIDE=2048 ~ 0.03 deg.
Extinction values for different filters are estimated using the E(B - V) conversion factors presented in [10], assuming an extinction to reddening ratio R=3.1 Additional factors for 2MASS, Spitzer-IRAC and WISE filters are from IRSA’s Galactic Dust Reddening and Extinction service.
References
| [1] | (1, 2) Hartmann & Burton 1997, Cambridge University Press. |
| [2] | Dickey & Lockman 1990, Ann. Rev. A&A, 28, 215. |
| [3] | Arnal et al. 2000, A&AS, 142. |
| [4] | Bajaja et al. 2005, A&A, 440, 2 |
| [5] | Kalberla et al. 2005, A&A, 440, 775. |
| [6] | Land & Slosar 2007, Phys. Rev. D, 76, 8. |
| [7] | HI4PI Collaboration et al. 2016, A&A, 594, A116. |
| [8] | Schlegel, Finkbeiner & Davis 1998, ApJ, 500, 2. |
| [9] | Planck Collaboration et al. 2013, A&A, 571, A11. |
| [10] | Schlafly & Finkbeiner 2011, ApJ, 737, 2, 103. |
Comparison between gdpyc and HEASoft nh
The plots below compare the nh values obtained using gdpyc’s
nhf() (left) and nh()
(right) methods against the results of the nh ftool included in HEASoft.
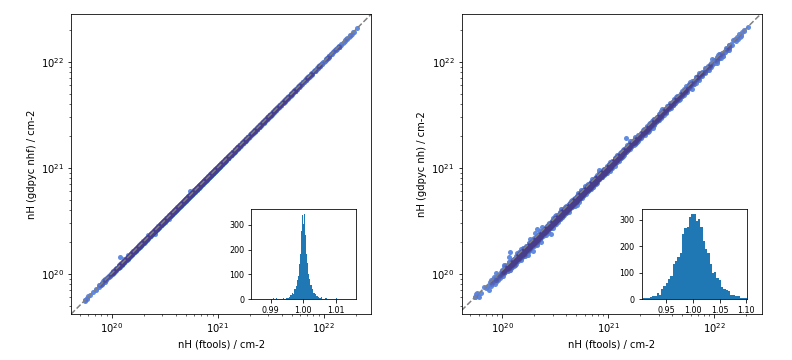
We obtained consistent results with both methods. The larger scatter for our
nh method is expected due to the lower resolution of the map
(~1 vs 0.675 deg) and the interpolation technique.
Here we show the nh ratios for both methods in all-sky maps: nhf (left)
and nh (right).
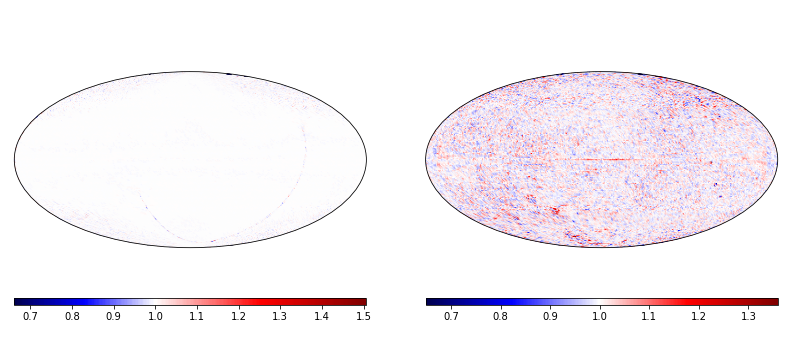
We included a Jupyter notebook in the documentation with the procedure to create these plots.